Paper battery electric vehicles (BEVs), you know, those that exist only on paper, are easy to debate. They weigh anywhere from exactly the same as the diesel trucks they are replacing to two or maybe three times that weight, depending on whose expert opinion is cited.
I am so happy that we are finally getting real production trucks entering the real world so we can quit arm waving and actually weigh the trucks on certified scales. Once BEV production starts, I have faith that the accountants, managers, fleet customers and, most importantly, the engineers, will immediately start endless decades of weight reduction efforts. This is what has preoccupied many diesel truck engineers for my entire career, so I have some confidence in that prediction.
Reading about truck weight shows how decision bias affects our perceptions of realities. It also demonstrates an aversion to detail and nuance in handling the complex topic of weight.
I have published hard data on weight that can be removed from a diesel truck in the process of thinking about making an electric one. Not just the obvious engine, but the entire support system for that engine including the exhaust and emissions systems, transmission and driveline, the cooling and lubrication systems, the air intake and filter systems, all the bracketry keeping these on the vehicle, and often overlooked, all the liquids – the fuel, the DEF, the oils and the coolants. All of that adds up to between 7,000 and 8,000 pounds on a representative diesel tractor as I reported in the 2018 Guidance Report: Electric Trucks – Where They Make Sense.
Having taken that diesel system weight out, there are a variety of estimates for what goes back in for a BEV based on many sources, often in disagreement. This will be so much easier when anyone wishing credibility will just need to run a production BEV tractor across a certified CAT scale. In the absence of that hard data today, educated guesses and just plain guesses abound.
We have hard data today on actual diesel vehicle weights in everyday real-world operations. The distribution of truck weights has been measured and reported by a number of independent, credible sources.

The graph shape of the distribution of freight weights over time looks like the Golden Gate Bridge (what engineers call bi-modal), meaning there are two peaks representing the highest volume of vehicles. The two towers of the bridge (the peaks of the graph) occur at the low end around 37,000 to 40,000 lbs. gross vehicle weight (GVW) and at the high end about 72,000 to 80,000 lbs. Just like the bridge's high tension wires, truck weights vary all the way across the span.

I have been collecting reports on freight weight for years, first in my job at a major truck manufacturer and then for NACFE. I first publicly re-published two graphs from M.J. Bradley and New West Technologies in my 2016 SAE report Fuel and Freight Efficiency – Past, Present and Future Perspectives. The curves were originally reported in a 2010 National Academies of Sciences, Engineering and Medicine Transportation Research Board (TRB) report Technologies and Approaches to Reducing the Fuel Consumption of Medium- and Heavy-Duty Vehicles. Because the topic never seems to fall out of vogue, I again cited these graphs in NACFE’s 2019 More Regional Haul – An Opportunity for Trucking.
More recently I had the fortune to talk with Professor Sarah Hernandez of the University of Arkansas about studies she has participated in using weigh-in-motion (WIM) data from real world highway weigh stations. An excellent resource on weight is her TRB paper Estimation of Average Payloads from Weigh-in-Motion Data. Another with Hernandez as a co-author published by the American Society of Civil Engineers (ASCE) is Gaussian Mixture Model to Characterize Payload Distributions for Predominant Truck Configurations and Body Types. A third with Hernandez as co-author from TRB discusses data from the Truck Activity Monitoring System for Freight Transportation Analysis.
Professor Hernandez explained that weigh-in-motion has a base system that measures and records axle weights, but with some modification and the addition of photography, the system can monitor what type of vehicle was carrying the load. These reports then quantify actual real-world data of trucks passing on various highways. One categorizes them as van, livestock, low boy, drop-frame, basic platform (flatbed) and tank trailers. Another categorizes them as van, platform, bulk, reefer, logging, livestock, auto carrier and tank. These reports are an amazing clarification with photographs and auditable data of what these example highways see over time. These researchers recorded the actual measured weights and vehicle types, then, typical of data scientists, created mathematical models to represent the data for further uses. My focus is on freight, so I will stick to showing just the van trailer graph from one report.
The graph shows the actual statistical distributions of the vehicles for each load, not averages. I don’t ascribe much to using averages as I discussed previously in the blog The average truck, but people often need to use one value to represent a diverse population of data. Looking at the Golden Gate Bridge shaped bi-modal graphs, I concluded before that more than 70% of vehicle runs are below 70,000 lbs. GVW.
There is a lot of complexity in that statement. Often that gets interpreted as 70% of trucks operate below 70,000 lbs. That is not correct. The metric here is loads, not trucks. I’ve stated before that diesel trucks are the Swiss Army knife of vehicles, able to haul in multiple duty cycles. In discussions with NACFE’s Chairman Rob Reich, executive vice president/chief administrative officer of Schneider, he clarified that because many loads are unpredictable, one day the truck may cube out and the next it might weigh out. Diesels generally are capable of doing it all.
In research on the amount of empty backhauls, or what I frequently term as deadheading, there is a surprising amount of hauling empty trailers. A 2016 J.B. Hunt report 660 Minutes: How Improving Driver Efficiency Increases Capacity, highlights data that deadheading can take some 75 minutes each day from driver’s time. A National Private Truck Council (NPTC) Benchmarking Survey Report 2021 concludes from survey data that empty backhaul miles occur between 21% to 33% each year. My own survey in the past of annual reports to the Securities and Exchange Commission (SEC) for publicly traded fleets has shown on the order of 13% reporting empty miles per year is not uncommon. For some dedicated fleets, empty back hauls may be as high as 50%. The left side of our Golden Gate Bridge graph below ~32,000 lbs. (an estimated tare weight of an empty tractor trailer) reflects that a lot of empty miles are hauled. Each fleet is different, but trailers and loads are not always in the same place. For a deeper dive on that, see NACFE’s 2019 report The Feasibility of Intentional Pairing.
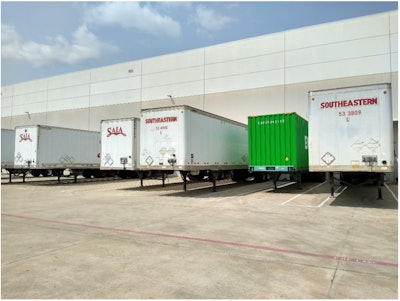
Discussions with drayage hauler NFI’s Bill Bliem, senior vice president of fleet services, and public statements by other NFI representatives, talk to another point in weight. All trailers are not alike. Drayage tractors are hauling ocean-going containers that are 40 feet in length. The average weight of these is somewhere between 35,000 and 40,000 lbs. Paired with a day cab diesel tractor and container chassis, these combinations rarely (if ever) see 80,000 lbs. NFI’s Jim O’Leary, vice president fleet services, said they “are maxing out of the ports with our current customer base at around 72,000 pounds.” This is one of the reasons that drayage has a great deal of interest for battery electric vehicles in the Southern California regions and at other ports. I took this picture at a warehouse in North Texas to show an example of the variety of trailer lengths seen in hauling. This has 53’, 48’, and 40’ lengths. There are many others.
Beverage hauling is another example of complexity. Mike Roeth, NACFE’s executive director, and I were both surprised to find that companies like PepsiCo, Anheuser-Busch and Biagi Brothers — all beverage haulers — are very interested in electric vehicles. In discussions with their freight management teams, they are focused on EVs for these heavy loads.
Two of these fleets operated EVs in NACFE’s recent Run on Less - Electric. Keshav Sondhi, vice president of fleet and sustainability at U.S. Foods and previously at PepsiCo, and a NACFE board member, has presented several times at major industry events on why beverage is an attractive fit for electric trucks. The combination of short overall daily distances, long overnight dwell times and shorter trailers means that these payloads and daily operations are not constrained by the weight of the battery packs. They are a path to helping companies meet their sustainability goals.
Weight is an ever-present topic of discussion with all freight haulers. Opinions, facts, biases and experience all tend to be jumbled together into broad all-inclusive statements about an entire industry, an industry that is very complex and nuanced. As the new production BEV trucks and tractors start rolling off the production line and into the hands of fleet customers, I cannot wait for those fleets and researchers to get hard weigh scale data on these vehicles and get past the confusion.
Rick Mihelic is NACFE’s Director of Emerging Technologies. He has authored for NACFE four Guidance Reports on electric and alternative fuel medium- and heavy-duty trucks and several Confidence Reports on Determining Efficiency, Tractor and Trailer Aerodynamics, Two Truck Platooning, and authored special studies on Regional Haul, Defining Production and Intentional Pairing of tractor trailers.