In my earlier article on supply chain, I stated many of the problems we were facing could be traced to the simple fact that the shipping systems as a whole continued to grow to record levels — reaching or in some cases exceeding full capacity.
Since that time, container traffic has continued to grow. It is possible slowdowns in China may have muted this somewhat, but overall it remains true.
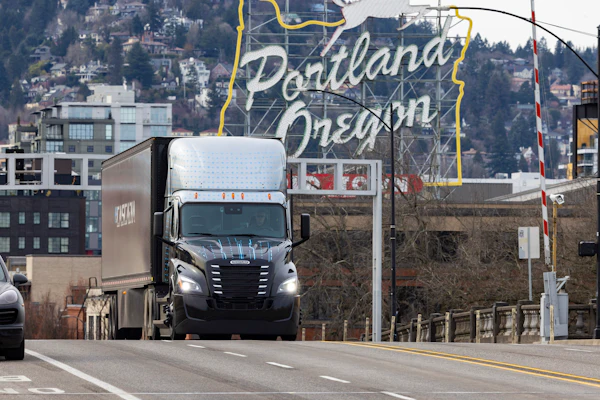
In this update, I will discuss the ocean freight situation. In a future article, I’ll turn the focus to the domestic side of shipping. (Hint: We'll find that while the ocean freight side has improved, we now have a serious problem on the domestic side between rail and trucking.)
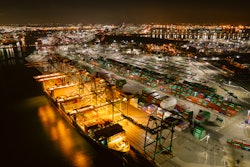
Recently, freight expert Descartes Systems reported that "as long as monthly U.S. container import volumes are above 2.4M TEUs, port congestion issues will persist until infrastructure changes are made. Port congestion became a significant issue when the U.S. consistently exceeded import volumes of 2.4 million TEUs per month starting in April 2021.
The company added, "To put this in context, 2021 container import volume was 18 percent higher than 2020 and 22 percent higher than 2019 and, so far, 2022 is higher than 2021. This continued volume increase is hard for U.S. infrastructure to efficiently absorb without capital investment to improve container processing capacity at ports."
In my opinion, an interesting and sometimes troublesome disconnect in the global shipping industry results from differing economic interests. Shipping lines are privately owned firms (some are publicly traded, but not government-controlled aside from some Chinese participants who are state owned.) Port facilities, however, are owned by governments. Here in the U.S., most are run by “port authorities” who while not directly a part of a major city are local government bodies. So, the resources and incentives to expand differ. And, as might be expected, decision-making and funding are generally much slower for the government actors.

[RELATED: With supply chain slowly improving, port worker contract negotiations loom large]
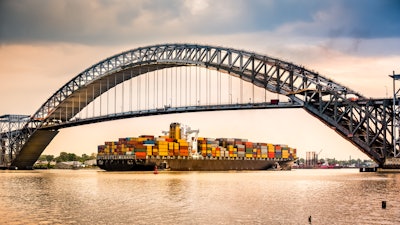
Some of the requirements can be daunting. For example, several ports have needed to raise bridges to accommodate larger ships. One recent example, the Bayonne Bridge in New Jersey was raised a few years ago, replaced with a better structure for container traffic. The project cost $1.6 billion and took years of construction. It was partially opened in 2017 though not fully in service until 2019. This opened several New York and New Jersey ports to ships as large as 18,000 containers. Yet now, just three years later, the maximum capacity of the largest ships in the world has reached 24,000!
Shipping costs – Current trends
Here’s the disaster story — Part 2. After many years of stability, per container shipping costs jumped by 300 percent (or more!) starting in early 2021. They briefly peaked at 400 percent and have retreated but are still at the 300 percent level.
A recent world container price index by Drewry tells the sad tale. Notice the recent run-up in fuel costs does not seem to be reflected directly in the cost index. This is most likely due to other factors decreasing. Fuel is the largest single element of shipping expense for the carriers. One other possibility is that frequently when fuel prices increase, carriers respond in part by cancelling some sailings and/or slowing the vessels. (This makes more efficient use of fuel, and the vessel itself while valuable is a 'sunk cost.' In retrospect, perhaps it’s unlucky to use the account expression sunk cost when referring to a ship!)
To be sure, while container freight is an important sector it's only one branch of the oceangoing fleet. The stories elsewhere are mixed.
[RELATED: How smart data analysis can expand sales opportunities with your existing customers]
Tonnage carried by liquified natural gas (LNG) has decreased with the decrease in Russian trade. Bulk freighters have also been affected, with reduction of grain from both Russia and Ukraine. The Russian/Ukraine war has had other ripple effects, not the least of which was the loss of many merchant marine crew, where both Ukrainian and Russian seagoing crew play a significant part. Some ports have barred Russian sailors from entry, even when on vessels owned and flagged to other nations.
Much was made of the unsurprising fact the large freight carriers have logged record profits. In balance, one should consider that for the previous ten years their profits were lackluster. In the future, we might predict a significant drop in prices. This is because in the past two years, carriers have commissioned record numbers of new container ships. Once these come on stream in a few years, we may predict a bust as supply grows quickly.
What’s going on in China?
Well, most know that there have been city-wide lockdowns, including the large, globally visible cities Shanghai and Beijing. Shanghai has been limping back towards fully open status while Beijing is partially open.
Less well known is that lockdowns remain in effect in many other Chinese cities. This author has read accounts estimating that as many as 400 million urban residents in China have been locked down in recent months. It hasn’t been possible to confirm these figures, as the government remains opaque.
Besides putting city dwellers in miserable conditions, these have had a national effect, depressing the economy. Reductions in shipping traffic from Shanghai were significant; while container costs skyrocketed and then fell somewhat, theoretically the port remained open, though trucks were not permitted in or out of the port. This had the obvious result of bringing traffic to a standstill as soon as incoming and outgoing backlogs were cleared.
As of May 3, RBC reported 344 ships awaiting berth at the Port of Shanghai, up 34 percent from the prior month and resulting in a 111-day journey from a Chinese warehouse to a U.S. warehouse on average. The typical average for the trip is 37 days.
Some of this traffic was relocated to the nearby port of Ningbo, which thankfully was able to accommodate some growth. (UniBond moves much of its freight through Ningbo, so we monitor it closely.) So, all in all, the ocean shipping side of the business, while still tight, has improved since the start of 2022! In the next update we’ll turn to the domestic side.